If you handle company expenses or procurement, you may wonder whether predictive spend analytics actually helps control costs, or if it adds another report to your pile.
Traditional spend analysis examines past and present spending to find inefficiencies. Predictive spend analytics builds on that by applying statistical models or machine learning techniques to uncover patterns and predict future spend behaviour.
That forward view matters. Organisations using predictive analytics in procurement report procurement cost reductions of around 18–22% and improved supplier management outcomes.
This blog explains what predictive spend analytics is, how it works, and the checks you need to apply before trusting the insights.
Key Takeaways
- Predictive spend analytics uses historical spending data to forecast future costs, helping businesses act before expenses spike.
- Companies using spend analytics can cut procurement-related costs by up to 5–20% in the first year.
- The process involves data collection, pattern recognition, forecasting, and risk flagging, improving budgeting accuracy and supplier negotiations.
- Real-time spend tracking allows for early alerts, preventing unexpected overspending and identifying low-value expenses.
- In 2026, predictive analytics will be crucial for cost optimisation, with businesses focusing on real-time data insights and proactive cost management.
Where Predictive Spend Analytics Helps Cut Costs
Predictive spend analytics gives teams early visibility into where money is likely to go. This helps prevent cost spikes, spot waste, and prepare for upcoming expenses with more confidence.
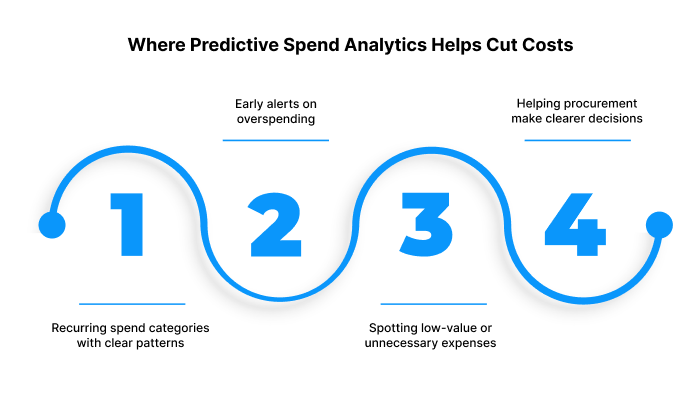
Below are the areas where it makes the strongest impact.
1. Recurring spend categories that show clear patterns
Many expenses follow steady rhythms, such as software renewals, utilities, maintenance, and office supplies. Predictive models capture these patterns and estimate future spend. This helps teams see when a cost is drifting away from its usual cycle.
Research indicates that structured spend reviews can reduce procurement-related costs by 15–20%.
2. Early alerts on overspending
When the system spots a rise in spend that doesn't align with expected trends, teams get an early warning. This prevents last-minute budget shocks and gives decision-makers time to pause, question, or re-route spending.
Companies using predictive methods report fewer unexpected cost escalations as a result.
3. Spotting low-value or unnecessary expenses
Predictive analysis highlights small but frequent costs that often slip through manual review, such as duplicate orders, unused subscriptions, and overlapping services.
These add up over time. Identifying and removing them leads to direct savings and cleaner vendor lists.
4. Helping procurement make clearer decisions
Procurement teams use forecasted spend to judge demand, compare suppliers, and negotiate from a position of information. Forecasts also reduce the need for rush purchases, which are usually more expensive.
A clear view of expected spending often leads to steadier cash flow and better contract terms.
When teams gain better control over spending, managing short-term financial gaps becomes easier. For individuals facing the same challenge on a personal level, Pocketly offers quick access to short-term credit.
With loan amounts from ₹1,000 to ₹25,000, a simple digital process, and fast transfers, it helps students, young professionals, and self-employed users handle immediate expenses without complications.
Also Read: How to Manage Monthly Expenses Smartly in 2025
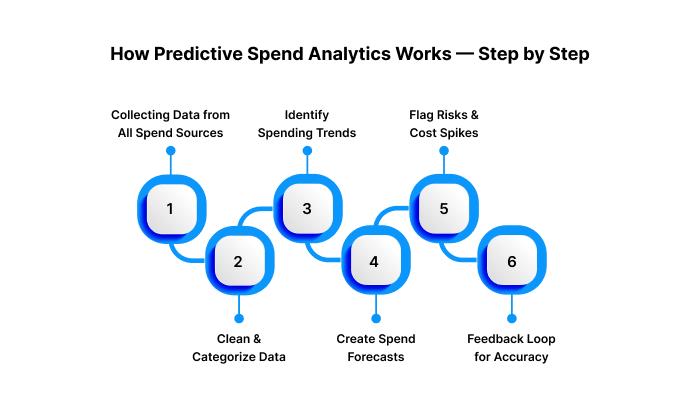
How Predictive Spend Analytics Works — Step by Step
Predictive spend analytics turns past and current spend data into forecasts that help teams act before costs spike. It goes beyond tracking invoices by offering early visibility into spending patterns.
Organisations using effective spend-management practices reduce overall spend by about 5.8% compared with peers relying on older or unstructured methods, which shows the value of a structured, forward-looking approach.
Let us now look at the step-by-step process that can make this happen:
1. Data Collection From All Spend Sources
Before any forecasting begins, companies bring together all spend-related records. This removes blind spots and creates one accurate source of truth.
What gets collected:
- Invoices
- Purchase orders
- Payment logs
- Contract data
- Expense claims
- Supplier statements
2. Clean and Categorise the Data
Once collected, the system sorts and standardises it. This ensures patterns can be identified without noise.
What happens here:
- Duplicate entries removed
- Supplier names standardised
- Expense categories assigned
- Incorrect entries fixed
- Approvers and departments are mapped correctly
Why it helps: Cleaner data means fewer false alerts later.
3. Identify Spending Patterns
With the data cleaned and grouped, the system analyses how money flows month after month. Many expenses follow steady rhythms, and this step clearly maps those rhythms.
Patterns most commonly identified:
- Subscription renewals
- Utility cycles
- Maintenance schedules
- Department-level order habits
- Supplier billing patterns
4. Create Forecasts for Upcoming Spend
Forecasts are based on past cycles, current activity, and recent changes in pricing or demand. These projections act as your baseline for expected spend.
What the forecasts show:
- Spend expected this week or month
- Categories likely to rise
- Suppliers with upcoming high-value transactions
- Areas where consumption is drifting upward
5. Flag Risk and Unexpected Cost Jumps
If upcoming spend drifts away from expected trends, the system triggers alerts. This gives teams time to review before costs move out of control.
Common triggers:
- Higher-than-normal invoice amounts
- Sudden supplier price changes
- A spike in orders by a specific team
- Renewal fees are higher than the last contract cycle
6. Feedback Loop to Improve Accuracy
After each cycle, forecast accuracy is evaluated. The system updates its understanding of patterns and supplier behaviour, improving future predictions.
Why this matters: The longer a company uses predictive analytics, the sharper the forecasts become.
Example Scenarios
These scenarios show how companies use predictive spend analytics to prevent waste and avoid budget shocks.
1. Cutting Software Waste
A tech firm discovers that two teams are paying for the same tools. Forecasts show the category rising faster than planned. The finance team spots the overlap, cancels one tool, and reduces recurring spend immediately.
2. Early Alerts on Operational Overspending
A manufacturing plant receives alerts when maintenance supply orders exceed their usual range. The operations team investigates and finds repeated orders for the same parts. They pause purchases and reset consumption guidelines.
3. Spotting Supplier Price Shifts Early
A company tracks raw material invoices. Forecasts predict stable pricing, but one supplier suddenly increases rates. The alert lets procurement act quickly by negotiating or switching vendors before the cost spike affects the quarter.
Tools That Support Predictive Spend Analytics
This section breaks down tool categories, what they do, and examples of platforms used by finance and procurement teams.
1. Tools for Spend Categorisation and Data Standardisation
These tools clean, structure, and categorise expenses so patterns can be found.
What they do:
- Pull data from ERP, AP systems, and invoice platforms
- Tag suppliers and categories correctly
- Remove duplicate or inconsistent entries
Examples:
- Sievo
- Ivalua
- Procol
- Zycus
Why these tools matter: Poor categorisation leads to inaccurate forecasts, so this layer builds the foundation.
2. Forecasting Dashboards With Spend Visibility
These tools present expected spend, current spend, and deviations in a clear dashboard format.
What they offer:
- Projected spend by category
- Alerts for anomalies
- Department-wise spend breakdown
- Supplier-level forecasts
Examples:
- SAP Ariba
- GEP Smart
- Coupa
- Payhawk
These dashboards help CFOs and procurement heads see issues before they become costly.
3. Spend Monitoring and Alert Systems
These tools scan transactions against forecasted baselines and raise early warnings.
What they track:
- Price changes
- Supplier contract breaches
- Category-level spikes
- Duplicate or unnecessary purchases
Examples:
- Suplari (Microsoft)
- Procurement Analytics tools inside Zoho Books or Tally Prime
- Beroe LiVE.Ai
These systems reduce manual review and keep teams informed in time to act.
Also Read: Digital Lending In India: Future Trends and Insights
What You Should Check Before Using Predictive Spend Analytics
Predictive spend analytics works only when the underlying data is reliable. High-performing firms manage up to 85% of their total spend under structured analytics, compared with the 55–60% average seen in organisations with weaker controls .
The wider the coverage, the clearer the forecasts. Before relying on predictive insights, here are the checks that matter.
1. Data quality and missing entries
Spend predictions break down when invoices, supplier IDs, or expense codes are incomplete. Run a basic completeness check to confirm what percentage of spend is actually captured.
2. Differences between planned budgets and actual transactions
Look for consistent gaps between budgeted amounts and real spending. Large gaps indicate either outdated budgets or untracked spending patterns that will distort forecasts.
3. How to validate early forecasts
Compare initial forecasts against actual spend for a few cycles. If the gap is wide, review your categories, supplier records, or historic data ranges before scaling usage.
4. Common mistakes to avoid
- Blindly trusting early predictions without review
- Incorrect or inconsistent categorisation
- Treating one-time costs as recurring patterns
- Ignoring supplier-level anomalies
Also Read: Understanding Lending In Banking: Types and Importance
As we look ahead, here’s where predictive spend analytics is headed and how businesses can stay ahead of the curve.
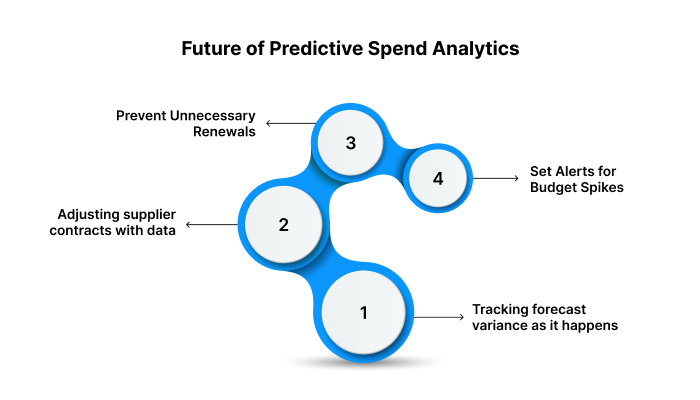
Future of Predictive Spend Analytics
Predictive spend analytics is shifting from static reports to live controls that sit close to daily decisions. AI-based spend tools are already spotting anomalies, duplicate invoices, and pricing shifts before they hit budgets.
Below are the areas where this shift will be felt most.
1. Tracking forecast variance as it happens
Variance analysis is moving from month-end reporting to continuous monitoring. Spend platforms now compare actual spend against budgets and forecasts in near real time and flag gaps that need action.
What this means in practice:
- Finance teams can see, during the month, which categories are drifting away from plan.
- Category managers can adjust volumes or timing rather than wait for a late report.
- Variance trends help refine the forecasting model itself, so each cycle gets more accurate.
2. Adjusting supplier contracts with data
Contract and spend analytics are starting to work together. Contract intelligence tools read historic contract terms and supplier performance, then link that to actual spend and service levels.
Over the next few years, you can expect:
- Renewal recommendations based on price trends, delivery performance, and dispute history.
- Suggestions for tightening service levels when suppliers underperform.
- Evidence packs for negotiation that show spend trends, price variane and incident data.
3. Preventing unnecessary renewals before they fire
Unmanaged renewals are a common source of waste, especially in software and outsourced services. Newer tools already track key expiry dates, link them to invoice data, and highlight contracts at risk of auto-renewal at weak terms.
In practice, this will look like:
- Dashboards that rank upcoming renewals by value and risk.
- Alerts when spend on a contract is falling while the renewal amount stays flat or rises.
- Suggested actions, such as downgrade, consolidate, or exit before the notice period ends.
4. Setting alerts for unusual spikes before they hit the budget
Anomaly detection is becoming standard in cost tools, especially for cloud and indirect spend. Systems learn normal spending patterns and automatically flag deviations.
You can expect:
- Instant alerts when spending in a category exceeds its normal range.
- Detection of duplicate invoices or suspicious pricing shifts from a supplier.
- Early warnings on cost spikes in cloud, utilities or marketing, where usage can change fast.
Pocketly: Simple Credit Support for Short-Term Financial Gaps
Predictive spend analytics helps companies control costs. On an individual level, short-term expenses can create the same pressure. Pocketly offers a straightforward way for students, young professionals, and self-employed users to handle urgent needs without delays or heavy paperwork.
What Pocketly Offers
- Loan amounts from ₹1,000 to ₹25,000 for everyday needs, month-end crunches, or unexpected costs.
- Simple digital KYC with no physical documents.
- Direct transfer to bank accounts keeps the process quick.
- Flexible EMI options, including partial payments and early closure.
- Transparent pricing with interest starting at 2% per month and a 1–8% processing fee.
- Support for students, salaried users, and self-employed individuals who need short-term credit without complications.
- No joining fee or annual fee, making borrowing straightforward.
Pocketly’s structure keeps the process simple, fast, and accessible. It gives users the breathing room to manage immediate expenses while staying in control of their finances.
Conclusion
Procurement analytics now drives how teams manage vendors, budgets, and supply‑chain risk, and the shift shows in measurable results. Organisations using advanced spend analytics report reduced procurement costs, better supplier decisions, and faster responses to market changes.
Just as companies use data to predict and manage expenses, Pocketly offers individuals the same power to make confident financial decisions without waiting for the end of the month to address financial gaps.
Take control of your finances today — download the Pocketly app for iOS or Android and access quick, hassle-free loans whenever you need them.
FAQs
Q: How does predictive spend analytics differ from traditional spend analysis?
A: Traditional spend analysis reviews past spending trends, while predictive spend analytics forecasts future costs. It allows businesses to anticipate budget variances and take proactive measures rather than react to discrepancies after they occur.
Q: Can predictive spend analytics help reduce supplier risk — not just cost?
A: Yes, predictive analytics monitors supplier performance, identifies price fluctuations, and highlights risks early. This gives businesses the chance to renegotiate contracts or find alternatives, reducing supply chain vulnerabilities.
Q: What range of spend does predictive spend analytics realistically cover in a company?
A: It typically covers 60–80% of total external spend. This includes direct and indirect costs, giving teams a comprehensive view of spend patterns and enabling better decision-making across the organisation.
Q: Is predictive spend analytics only useful for large firms with complex procurement?
A: No, small businesses can also benefit. Predictive analytics helps smaller teams optimise spending, identify inefficiencies, and manage cash flow without requiring large-scale data resources or complex infrastructure.
Q: What are the main limitations of predictive spend analytics that teams should watch out for?
A: Poor data quality and unforeseen market changes can limit the accuracy of predictions. It's essential to ensure data is accurate and consistently updated while being aware of external factors that could disrupt forecasts.